Design
Introduction
Now that we have a relationship between NDVI and mortality, we can design an insurance contract.
Load mortality predictions made the previous section.
d <- readRDS("pred_mort2.rds")
Remove some of the higher mortality predictions that occur with high ndvi. They are not relevant for us.
d$predicted_mortality[d$NDVI > 0.1] <- 0.1
Let us find a trigger above which the insurance pays. We set it so that we expect the insurance to pay out once every five years.
trigger <- quantile(d$predicted_mortality, 0.8)
round(trigger, 2)
##  80%
## 0.19
The trigger first occurs at this zNDVI
tndvi <- max(d$NDVI[d$predicted_mortality > trigger])
round(tndvi, 2)
## [1] -0.8
The payout — in units of the monetary value of TLU — can be computed as follows
d$pay <- pmax(0, d$predicted_mortality - trigger)
plot(d$NDVI, d$pay, cex=.1, xlab="NDVI", ylab="payout")
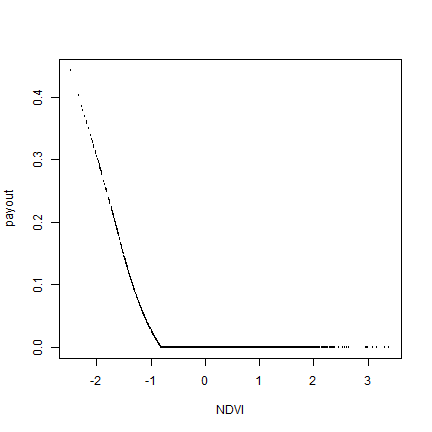
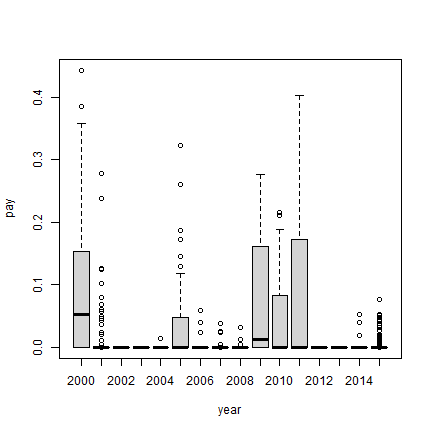
which is distributed over households, by years as follows
boxplot(pay~year, data=d)
We can simplify the relationship between NDVI and mortality like this
nd <- d[d$NDVI < tndvi, ]
m <- lm(pay ~ NDVI, data=nd)
plot(pay ~ NDVI, data=nd, cex=.1)
abline(m, col="red")
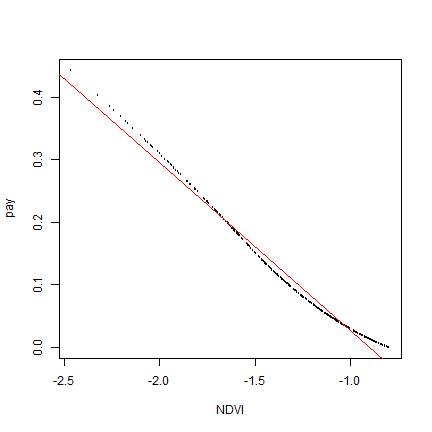
cf <- coefficients(m)
cf
## (Intercept)        NDVI
##  -0.2402589  -0.2675110
Contracts
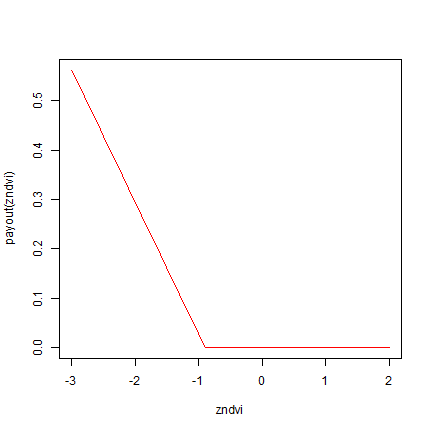
We can now design different contracts. The first would pay out according the model m above
payout <- function(zNDVI) {
  pmax(0, -0.24 + -0.2675 * zNDVI)
}
zndvi <- seq(-3, 2, .1)
plot(zndvi, payout(zndvi), type="l", col="red")
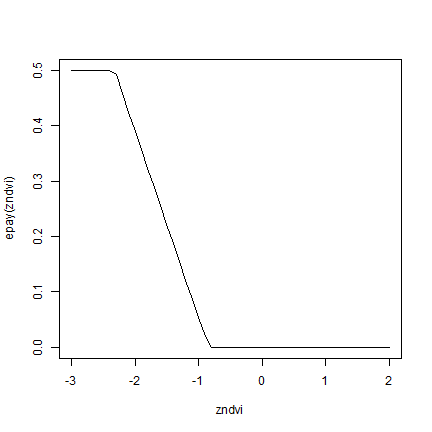
Another contract, folling Vrieling et al’s early payout scheme, triggers payouts when zNDVI is less than -0.842.
# need to adjust for payout scale (not TLUs?)
epay <- function(zNDVI, trigger=-0.842, exit=-2.326, frac=0.5) {
  zNDVI <- pmax(zNDVI, exit)
  frac * pmax( 0, (trigger-zNDVI) / (trigger-exit) )
}
plot(zndvi, epay(zndvi), type="l")
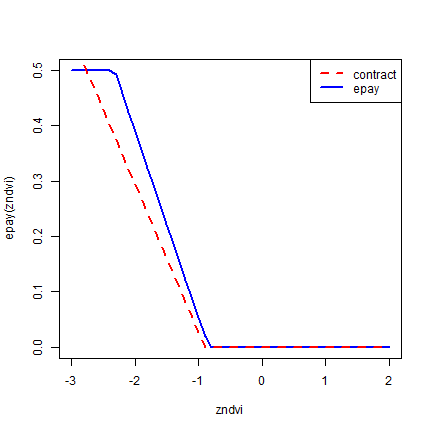
Plot the payout functions together.
plot(zndvi, epay(zndvi), col="blue", type="l", lwd=2)
lines(zndvi, payout(zndvi), type="l", col="red", lwd=2, lty=2)
legend("topright", c("contract", "epay"), col= c("red", "blue"), lty=c(2,1), lwd=2)